
North Star
Seequent had no shortage of metrics.
The problem was that they were not adding up to a shared understanding of success.
Different teams were working at different stages of the customer journey. Product was looking at one set of signals, marketing at another, sales at another, and leadership was still relying heavily on revenue as the dominant measure of whether things were working. Some of those measures were useful. Many were not. Quite a few were vanity metrics dressed up as progress.
That made it difficult to answer some very basic questions with confidence.
Were we improving the customer experience, or just generating activity? Were teams making decisions against the same model of value, or working in parallel with different definitions of success? And were we seeing the signals early enough to act, or only after revenue had already moved?
This programme set out to fix that.
My role was to help shape a clearer customer journey model, connect it to a more meaningful measurement framework, and define a “North Star constellation” across the full bow tie funnel — from path-to-purchase through to path-to-loyalty.
This work began with a fairly common but important organisational problem: everyone cared about growth, but not everyone was measuring it in the same way.
Across the business, teams were using different KPIs, many of which were not especially actionable and were only loosely connected to customer success. That made prioritisation harder, cross-functional alignment weaker, and strategic decision-making noisier than it needed to be. Revenue was still the dominant anchor, but revenue is a lagging indicator. By the time it tells you something meaningful, the underlying customer behaviour has often already shifted.
The opportunity was to create a more joined-up model.
Rather than treating acquisition, purchase, onboarding, use, renewal, expansion, and advocacy as separate reporting concerns, this work reframed them as parts of one customer journey. The goal was to connect customer value, business strategy, and team-level decision-making through a clearer set of leading indicators.
The Problem With Fragmented Metrics
Section titled “The Problem With Fragmented Metrics”The initial issue was not that Seequent had no measures. It was that the measures were fragmented, uneven in quality, and often disconnected from the actual customer journey.
Different teams were optimising for different signals. Some were useful local metrics. Some were proxies. Some were vanity measures that looked good in dashboards but did very little to help teams decide what to do next. The result was an organisation that could report activity, but not always interpret it in a way that supported clearer action.
Revenue was too late to be useful on its own
Section titled “Revenue was too late to be useful on its own”This was one of the central tensions in the work.
Revenue matters, of course. But as a signal for guiding product and customer experience decisions, it often arrives too late. If teams are relying too heavily on revenue alone, they are effectively driving by the rear-view mirror. They can see the outcome, but not always the behaviours and friction points that produced it.
What the business needed was a set of leading indicators connected to real customer movement through the journey. Not just outputs, but signals. Not just volume, but progress. Not just whether money appeared, but whether the experience was making purchase, adoption, use, renewal, and loyalty more likely.
Teams were not operating from one shared model of value
Section titled “Teams were not operating from one shared model of value”This was the more structural issue.
Without a common framework, prioritisation becomes difficult. Product teams make trade-offs based on one set of assumptions, marketing teams optimise for another, sales teams work against another, and leadership tries to stitch the whole thing together at the end. That fragmentation does not just create reporting problems. It creates strategic drift.
This programme was an attempt to create a clearer centre of gravity.
Reframing The Bow Tie Funnel
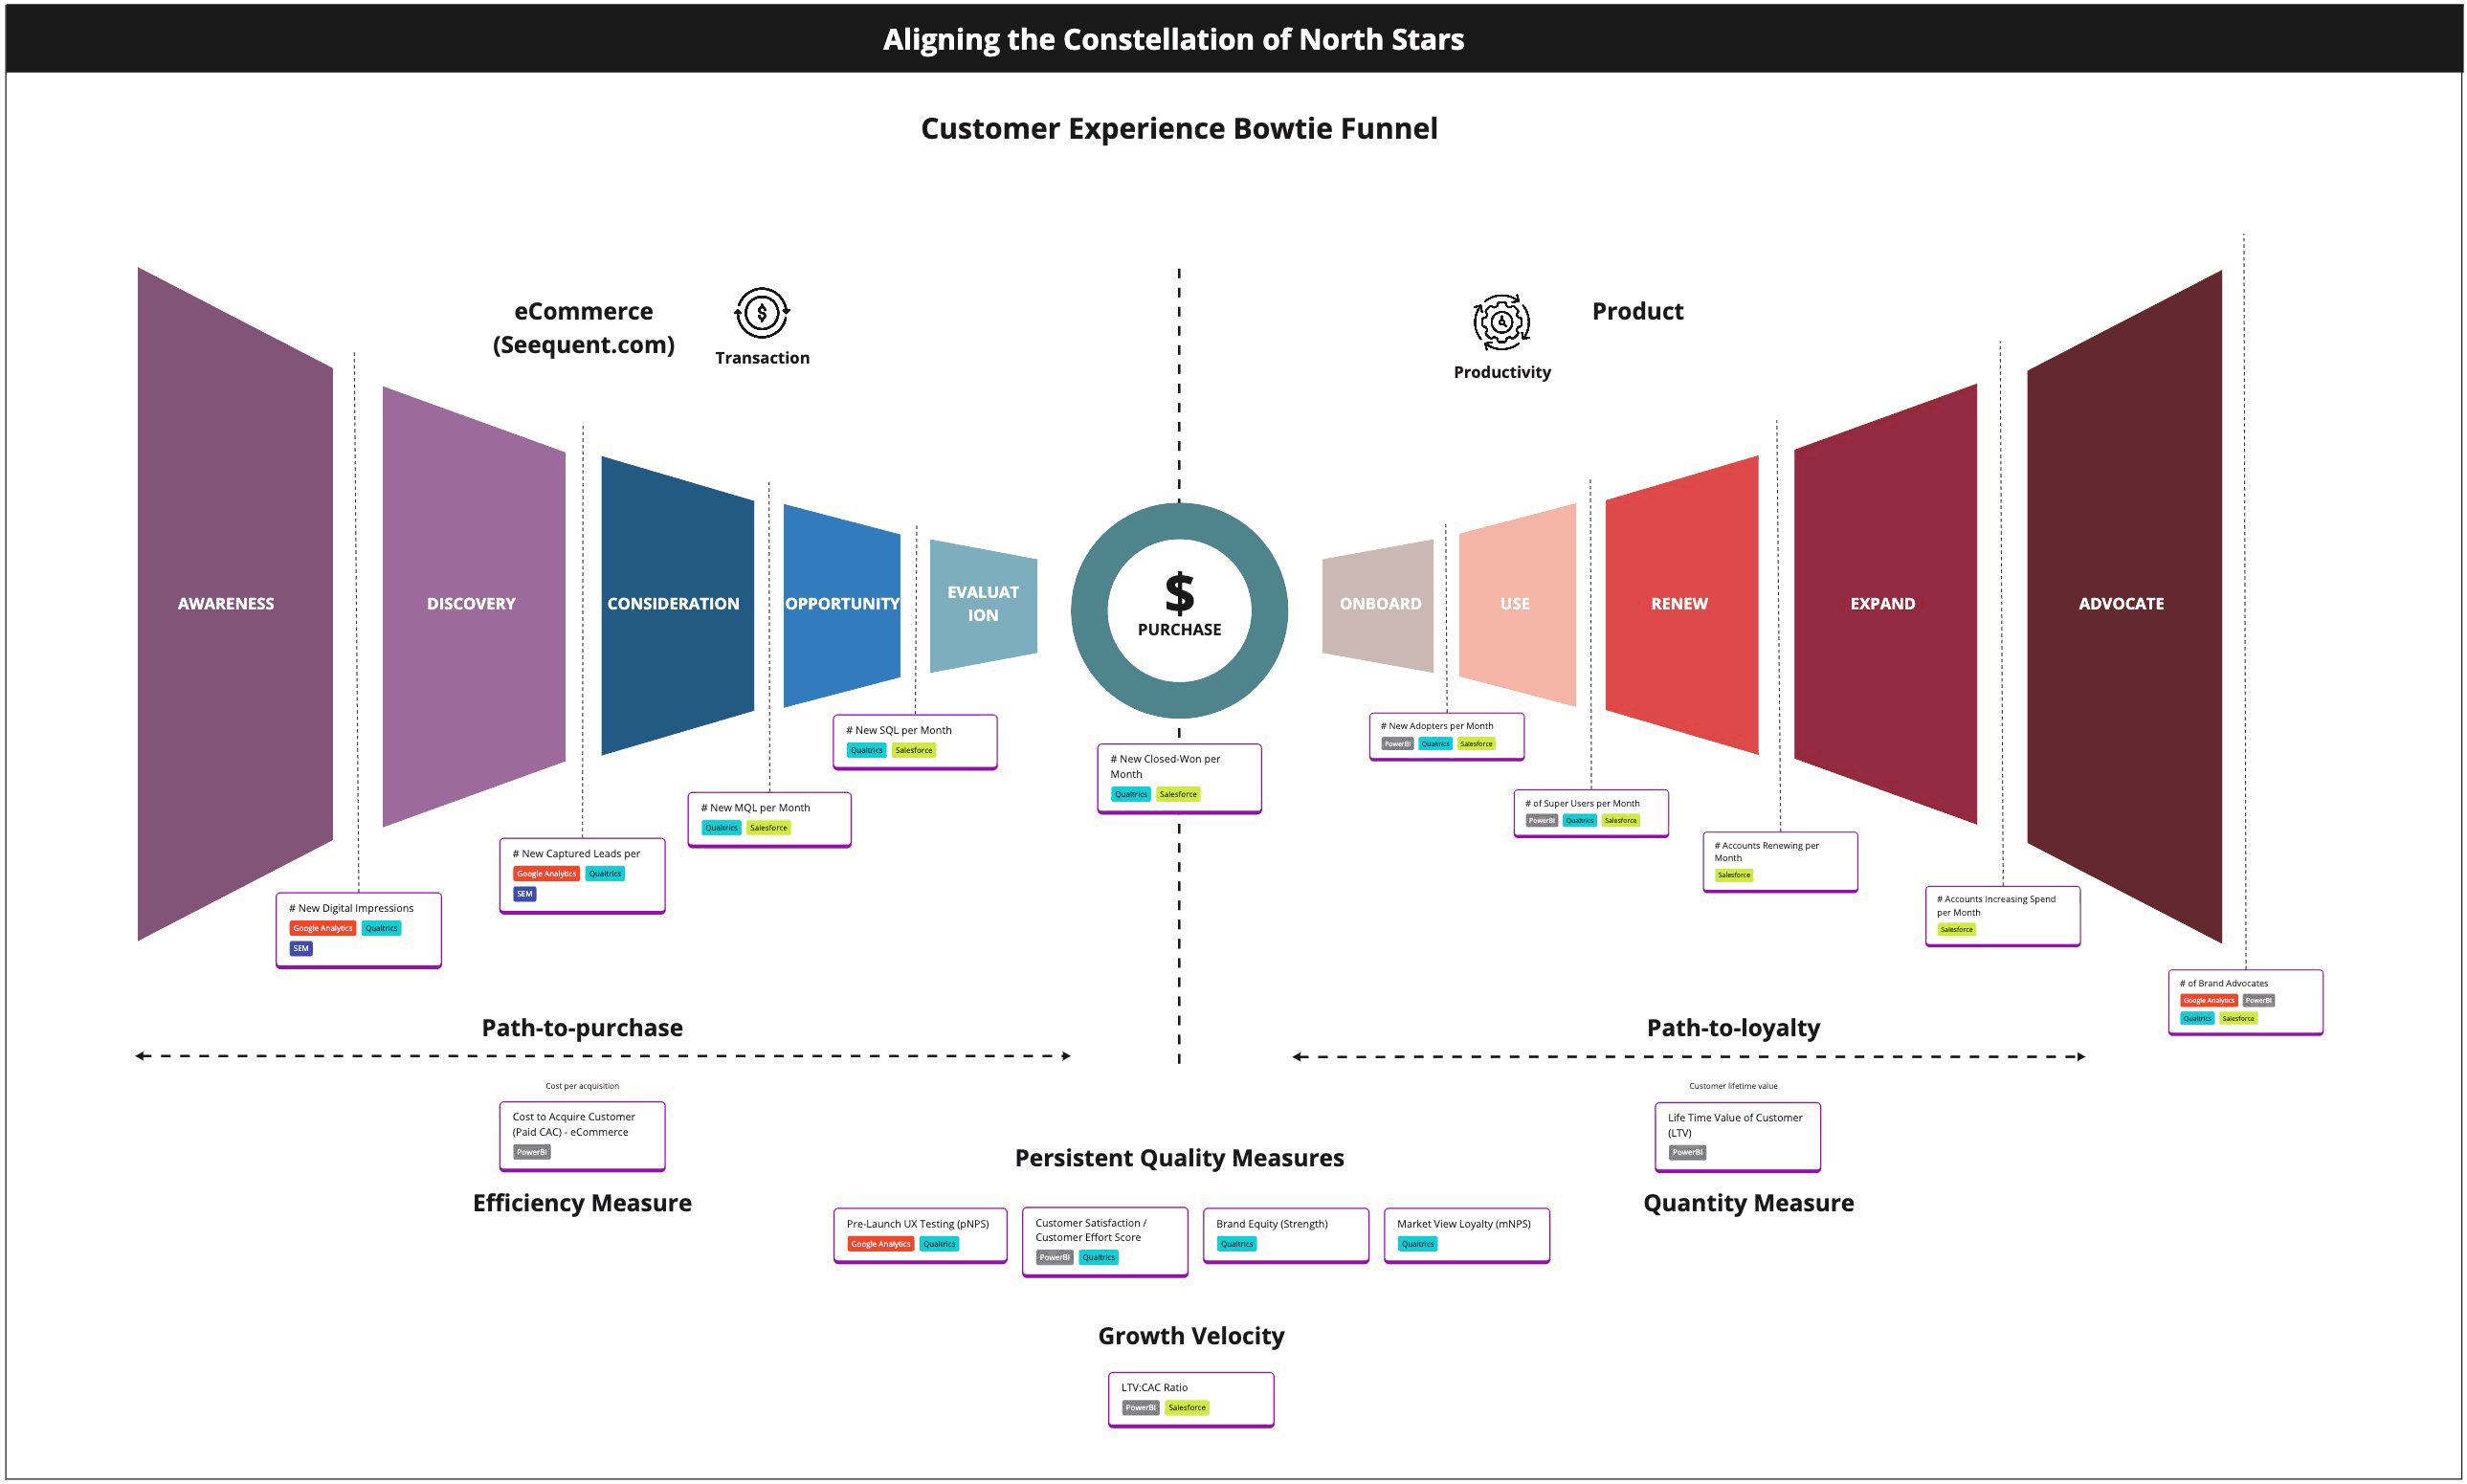
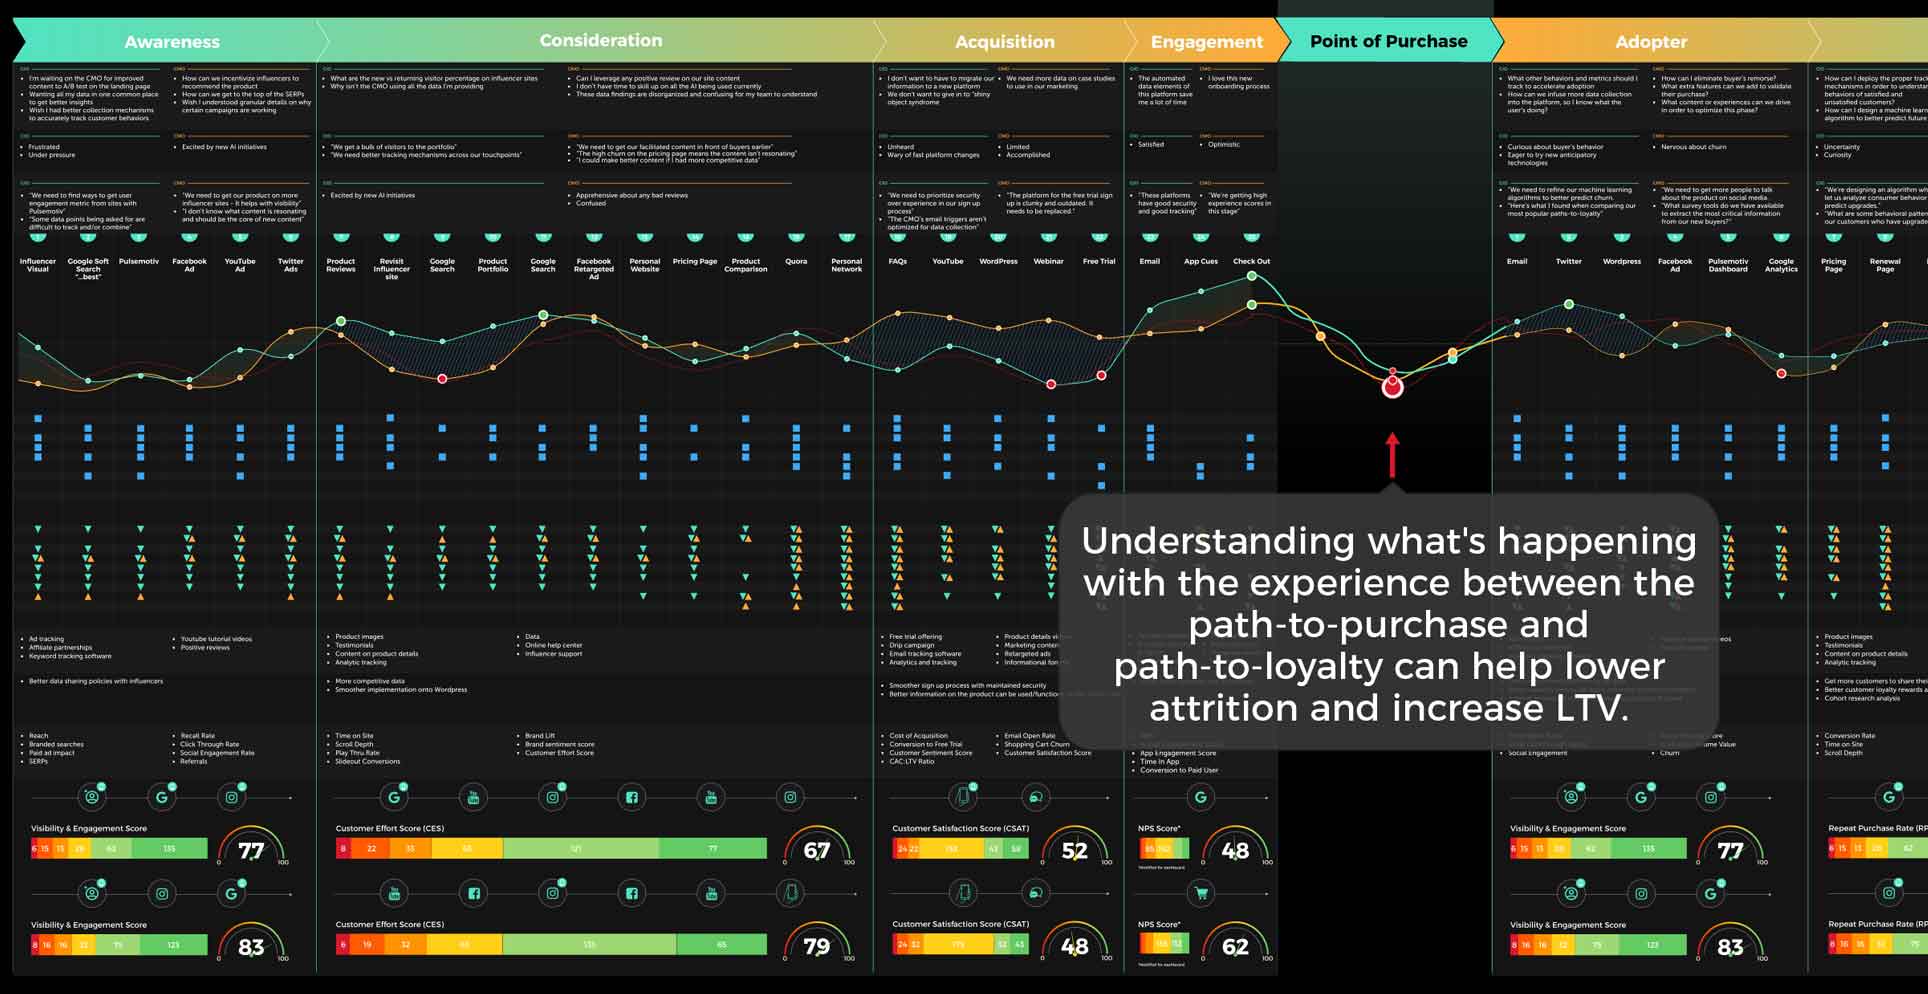
Section titled “Reframing The Bow Tie Funnel”The bow tie funnel became the structural model for the work because it gave the organisation a more complete view of the customer journey.
Rather than focusing only on pre-purchase conversion, it allowed the team to see the relationship between path-to-purchase and path-to-loyalty. That mattered because customer value was not created at the point of transaction alone. It was also shaped by onboarding, product use, renewal, expansion, and advocacy.
That shift changed the discussion immediately.
Instead of asking only how to acquire more customers, the business could ask:
- where are we creating confidence before purchase?
- what signals indicate quality, not just volume?
- what happens after the sale?
- how do we know whether customers are adopting, getting value, staying, and growing?
This was a more mature and more useful way to think about success.
Framing value in customer terms
Section titled “Framing value in customer terms”Another useful move in the work was translating the framework into simpler value concepts that were easier for teams to align around.
These became:
- Attention — how customers discover and engage with us
- Transaction — how the purchase experience works
- Productivity — how customers realise value over time
This was important because it pulled the framework out of abstract strategy language and closer to how the business actually created value for customers.
Designing The North Star Constellation
Section titled “Designing The North Star Constellation”I would not describe this as choosing a North Star metric.
That would make the work sound simpler than it was.
A single North Star can be useful in some contexts, but Seequent’s journey was broader and more layered than that. The more appropriate move was to create a constellation: a set of connected leading indicators mapped across the key stages of the customer journey.
This allowed different teams to retain meaningful local measures while still aligning to a broader strategic model.
From one metric to a system of signals
Section titled “From one metric to a system of signals”The value of the constellation approach was that it created end-to-end visibility.
Each phase of the journey could be connected to a leading metric, while still sitting inside a coherent system. That gave teams a way to understand not only what success looked like in their part of the journey, but how their work contributed to wider business outcomes.
It also meant that decisions could become more grounded in behaviour and customer movement rather than in isolated departmental reporting.
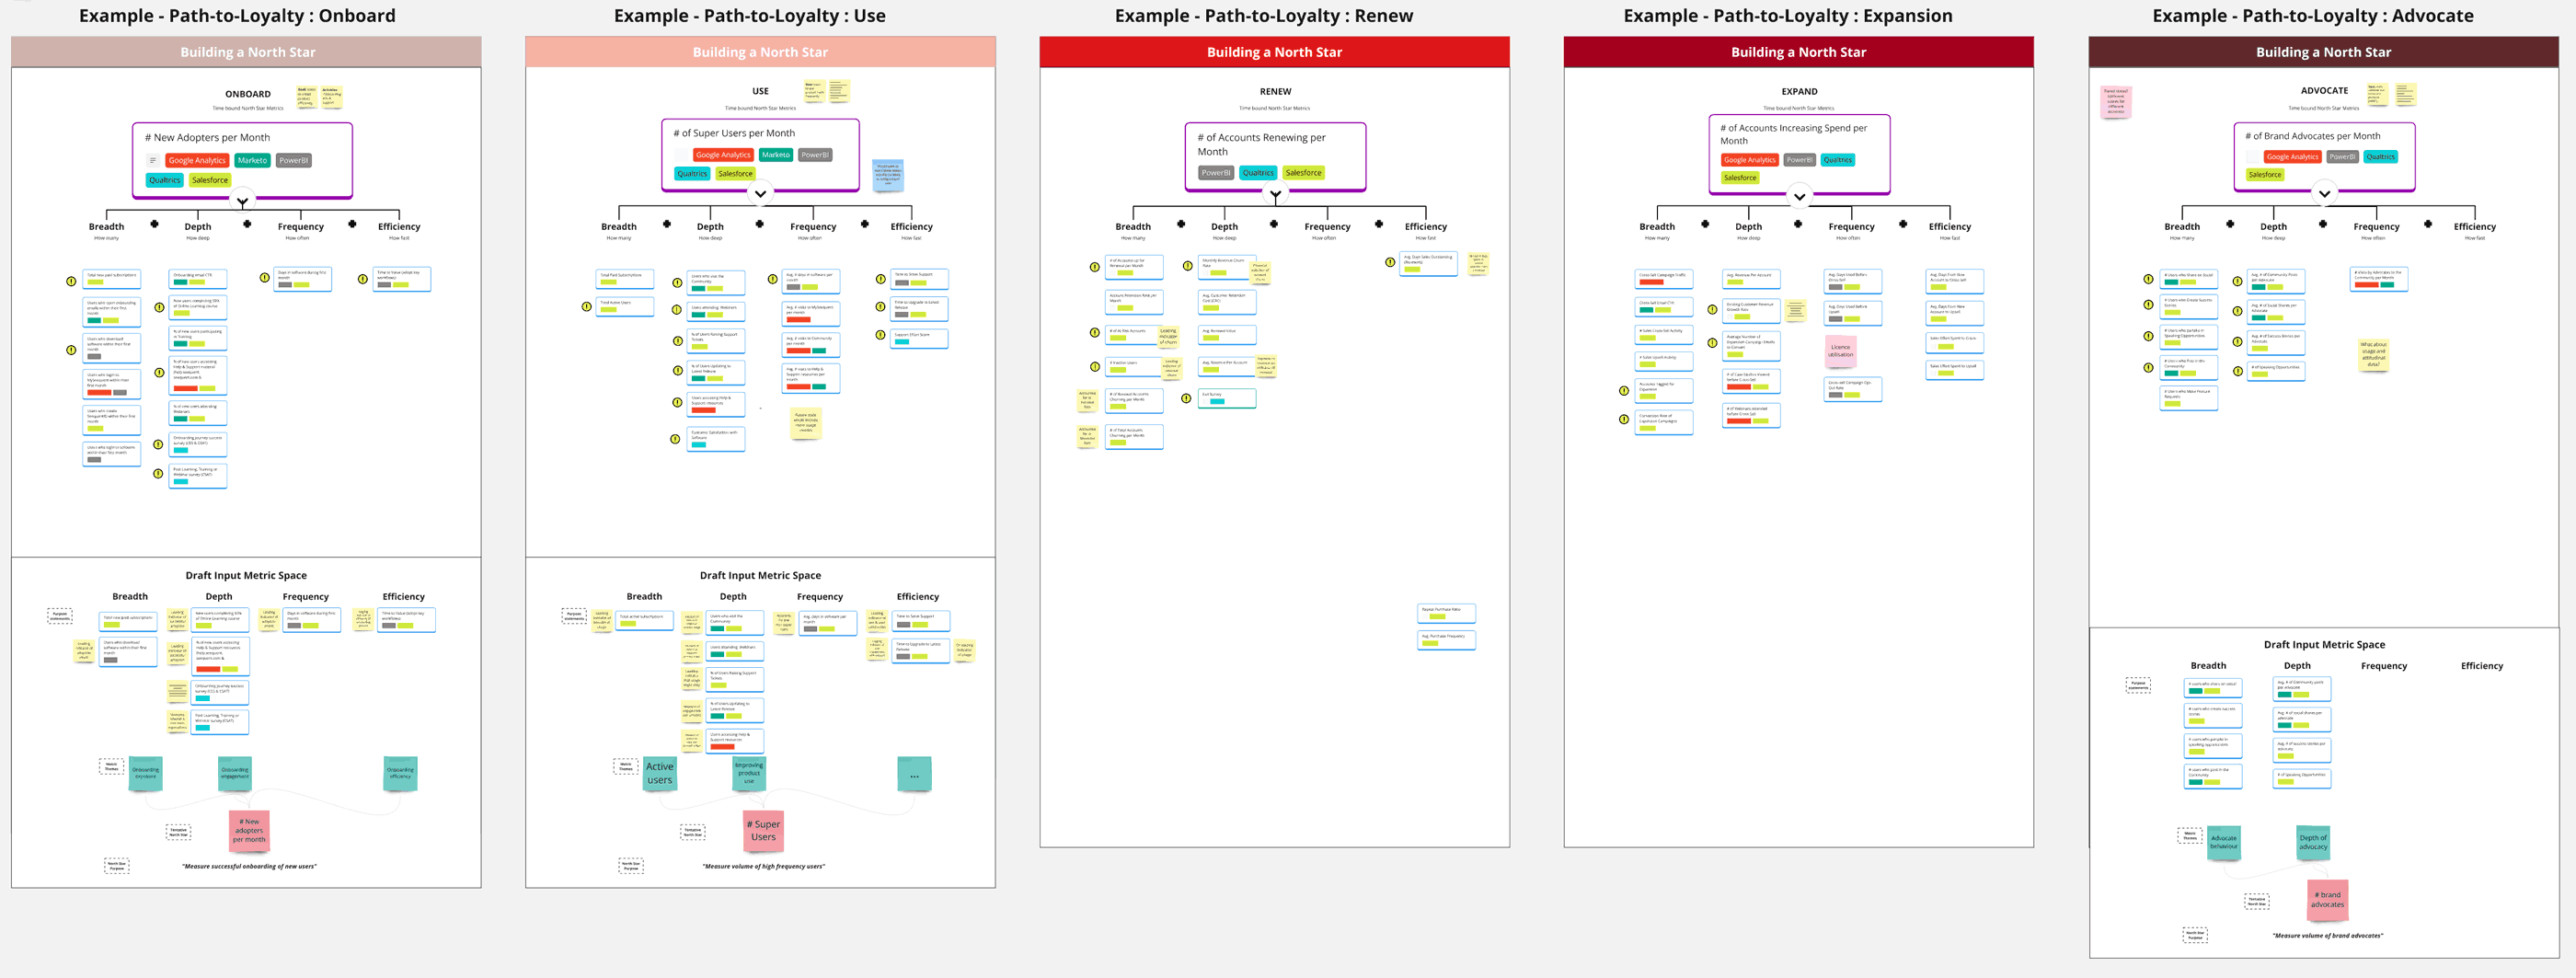
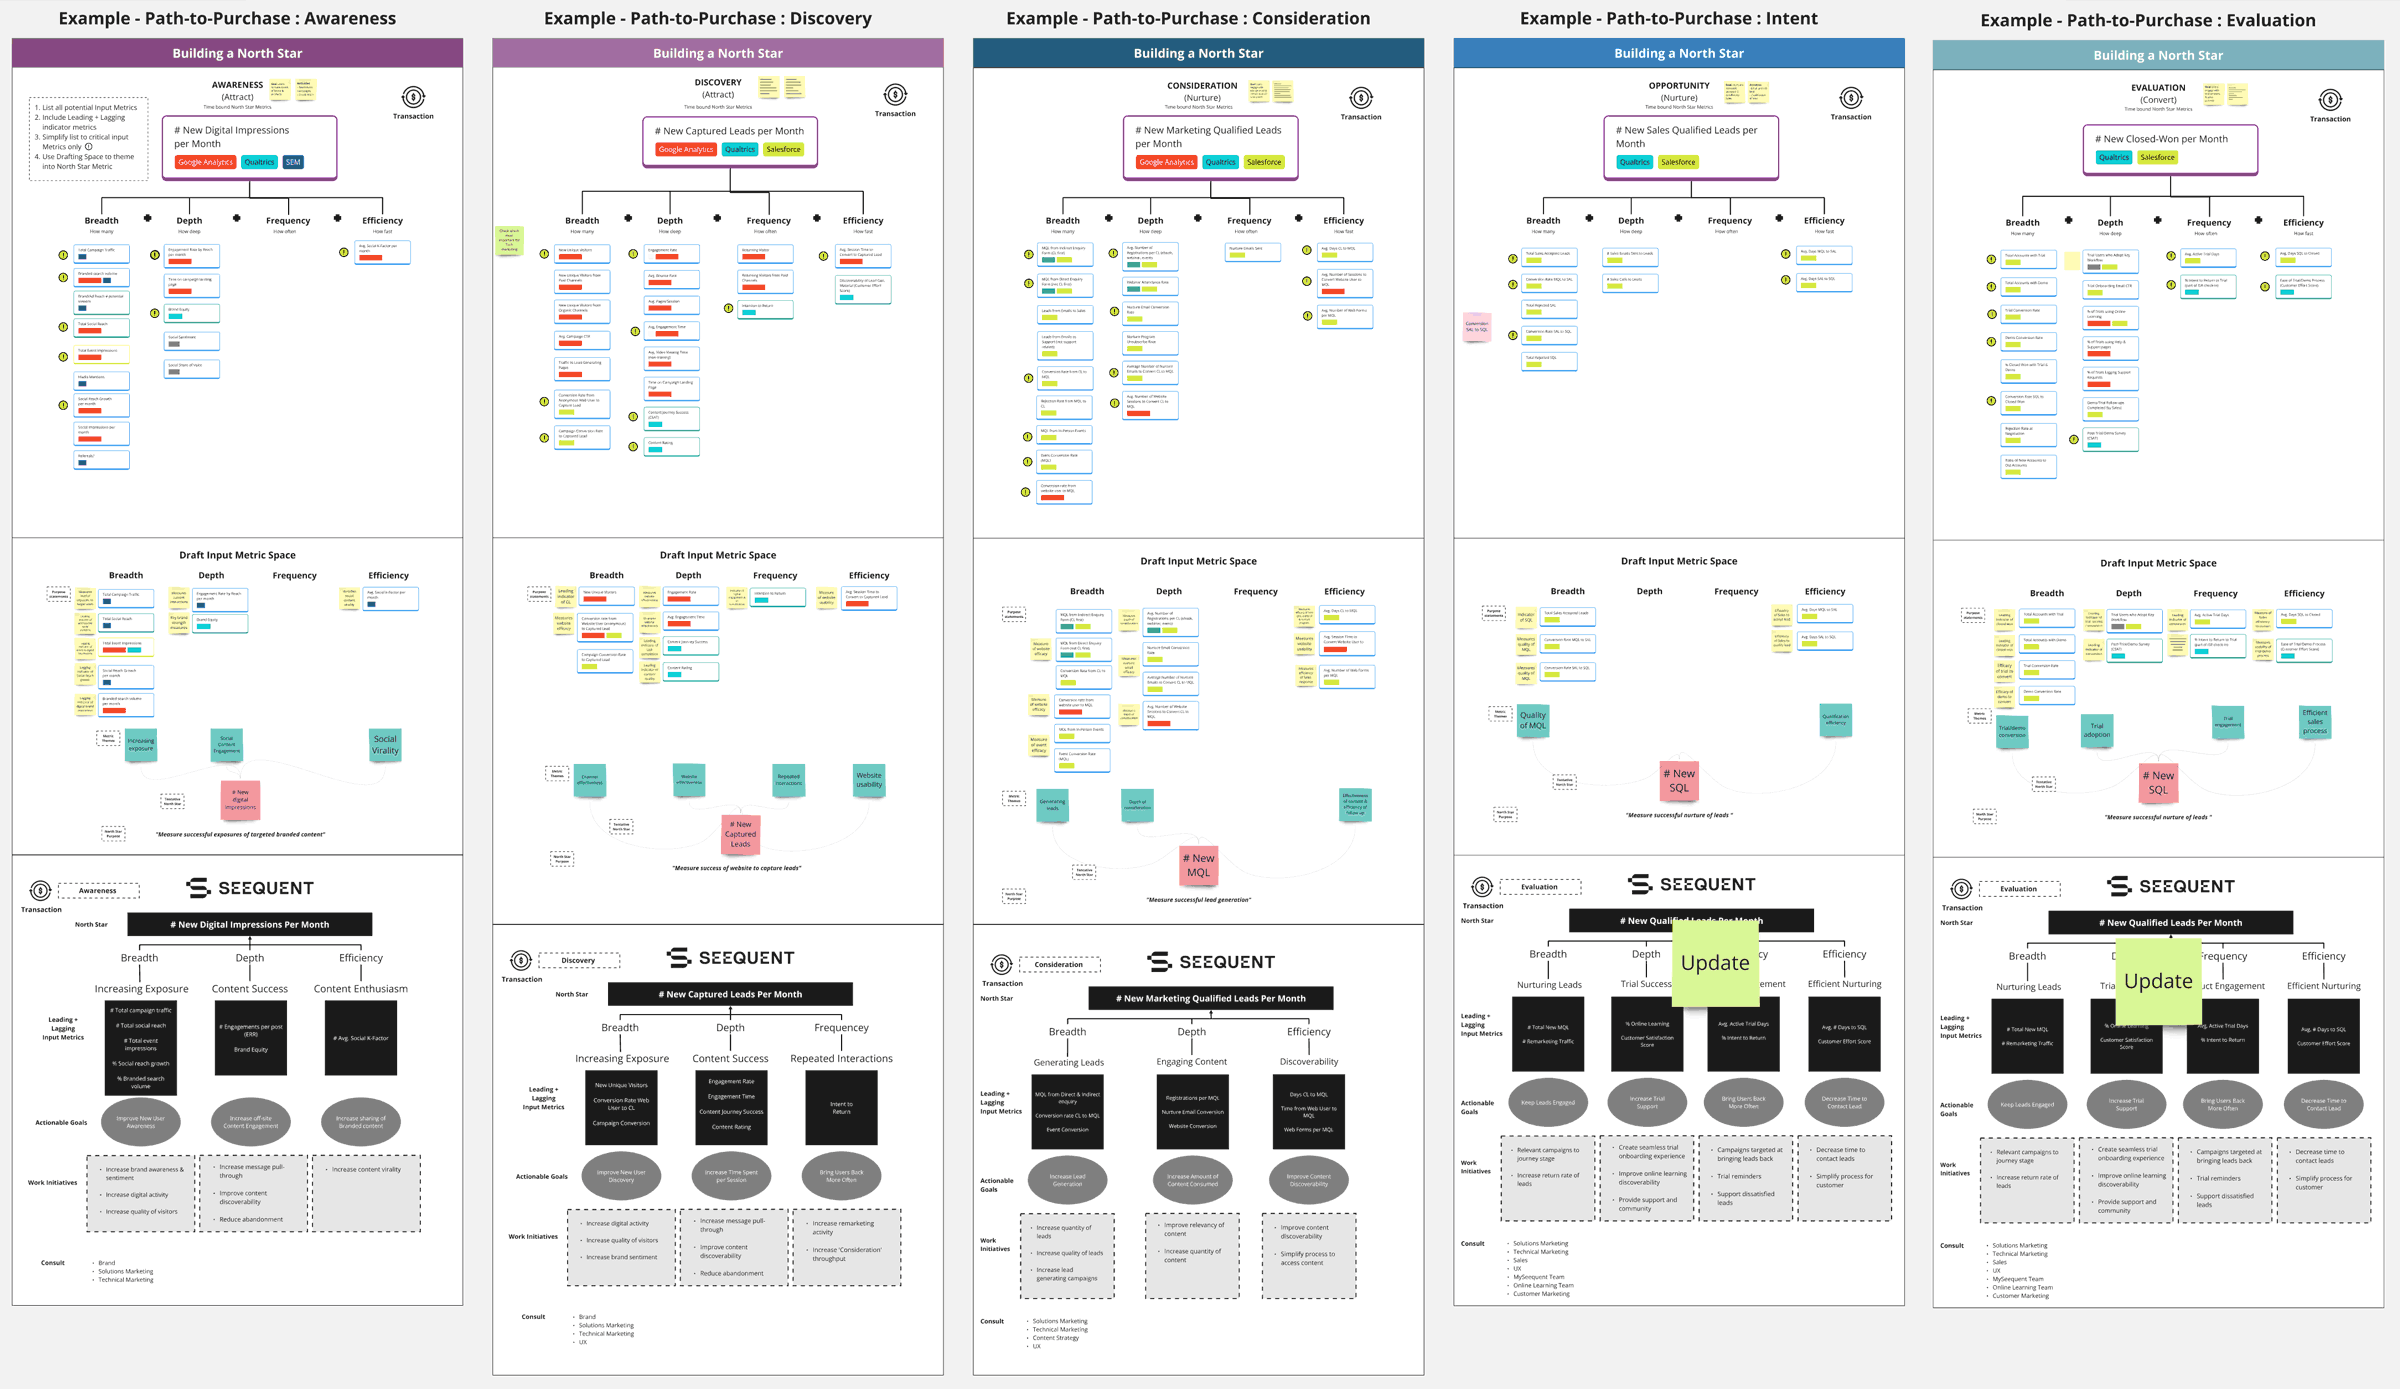
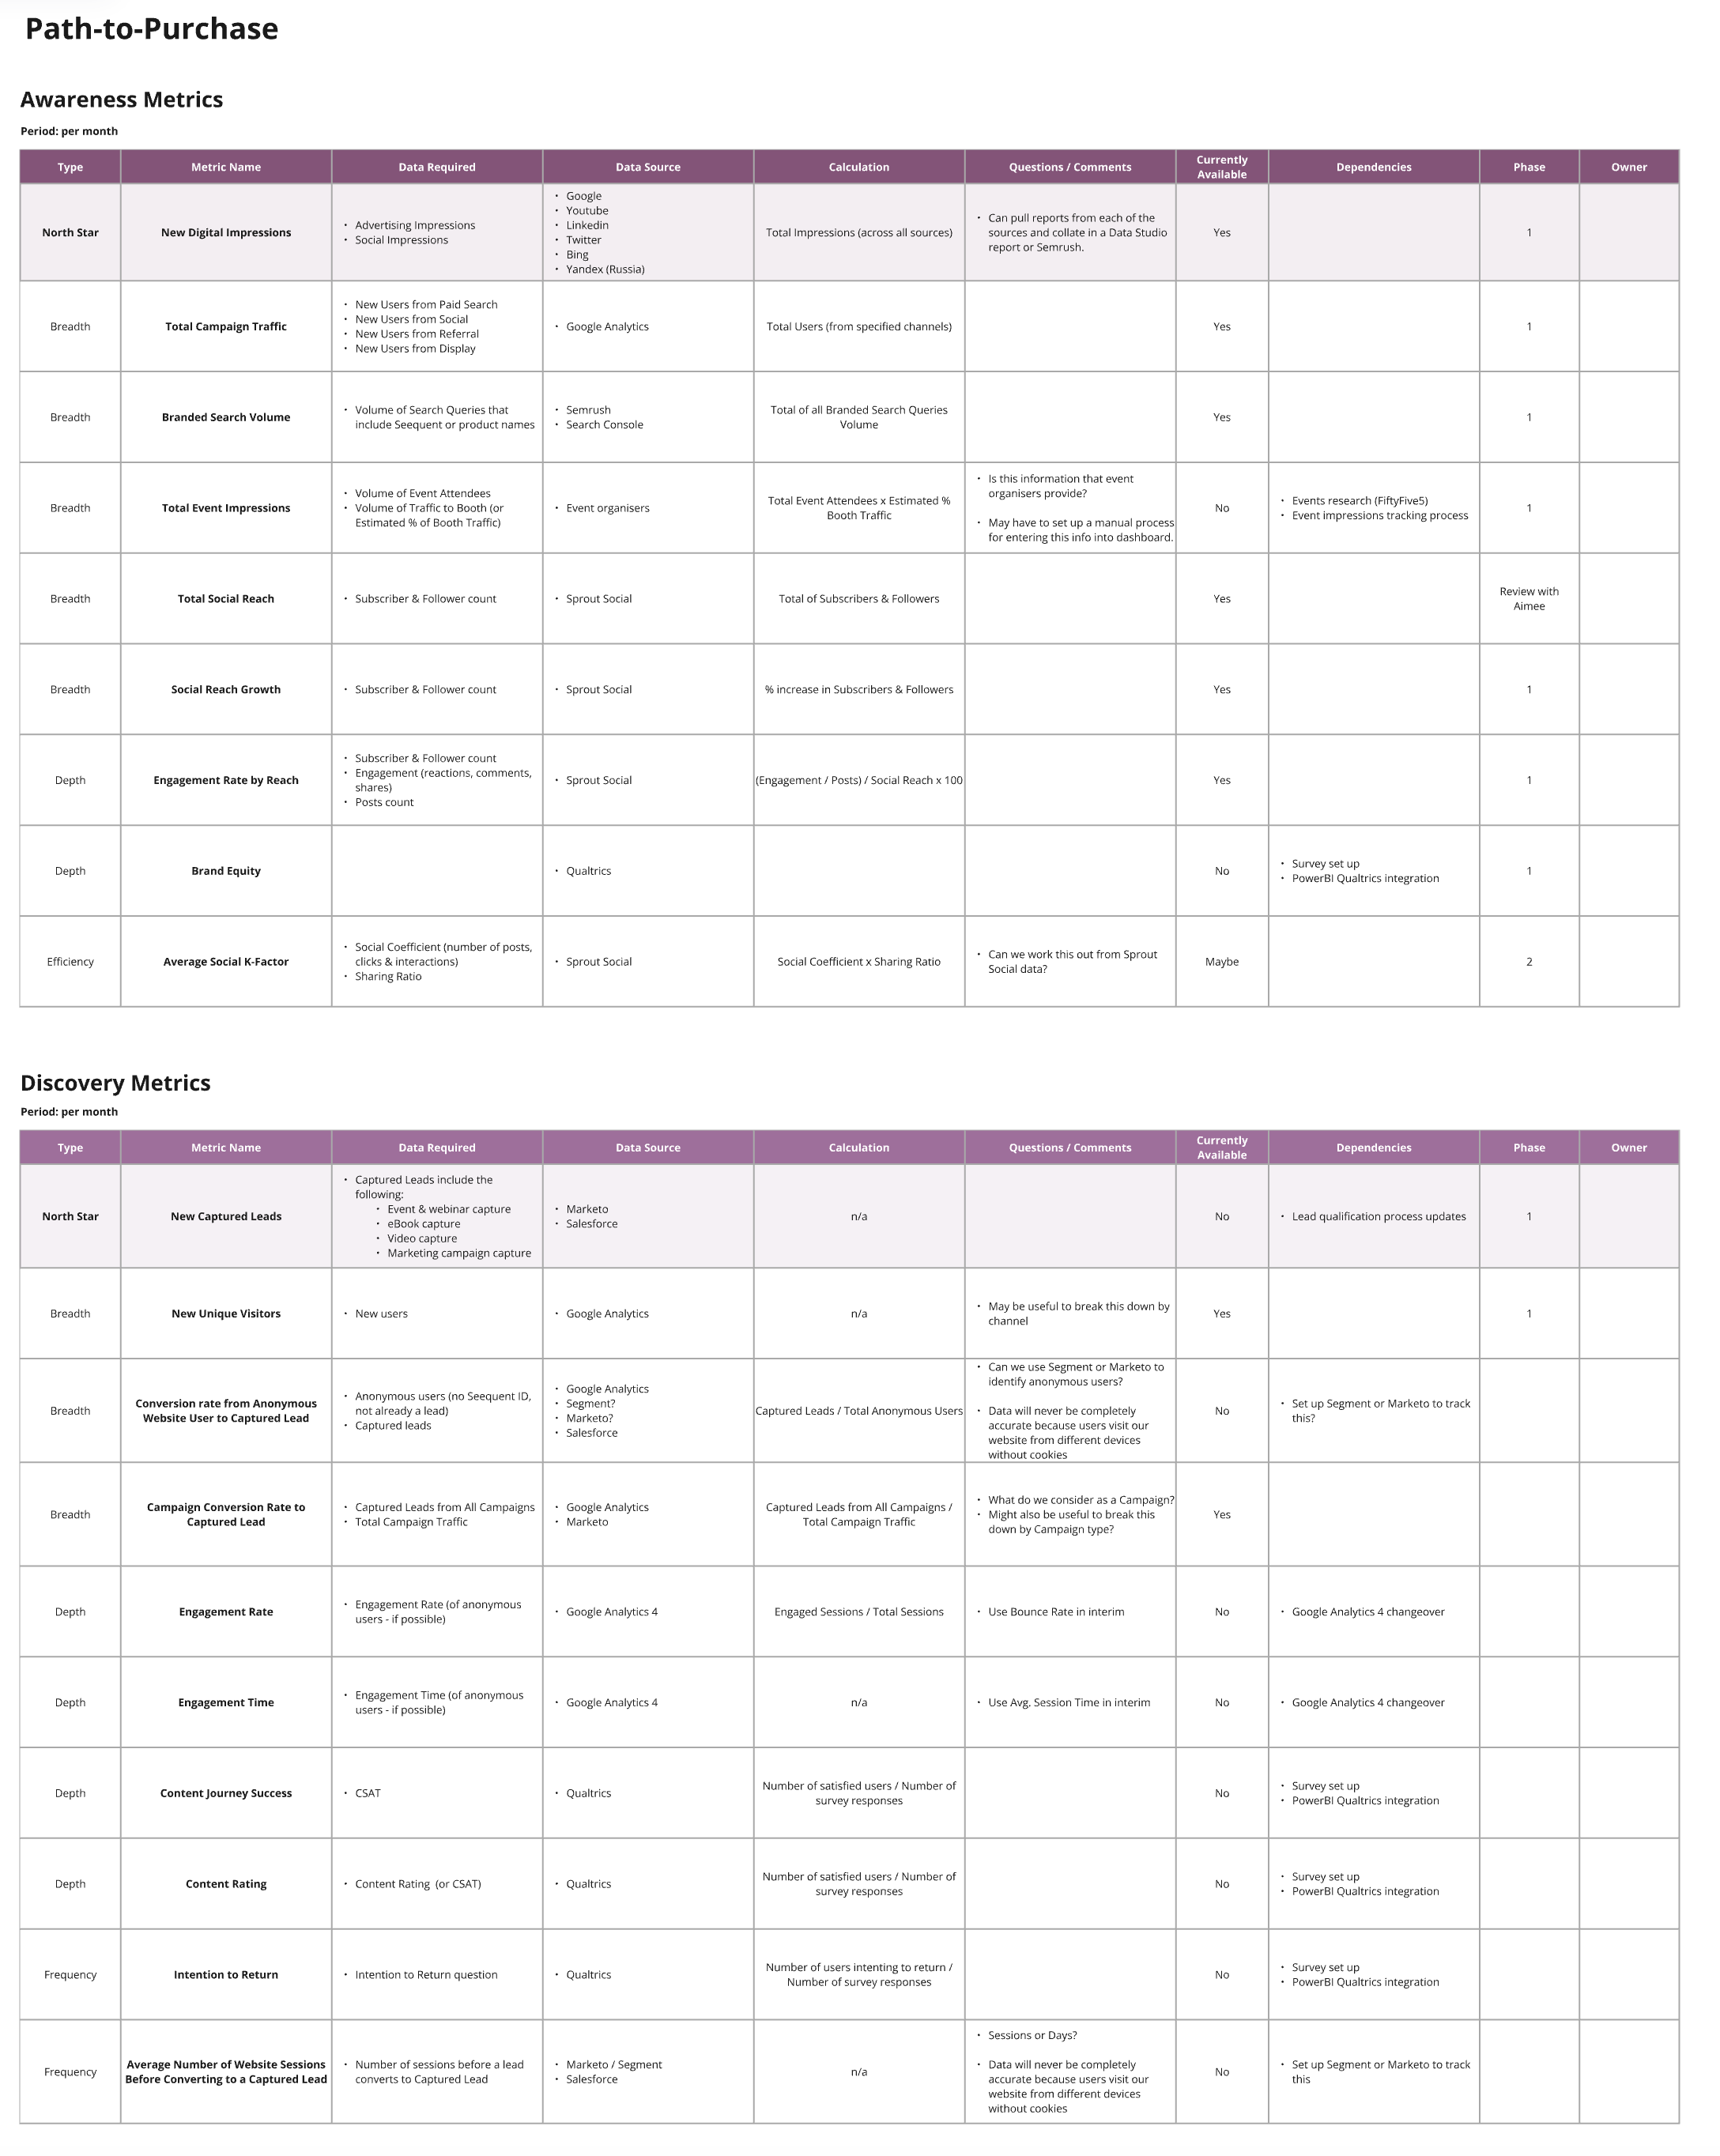
Mapping the metric space
Section titled “Mapping the metric space”Part of the work involved defining which measures mattered at each phase, what data existed already, what needed to be created, and where the gaps were. This was not simply a dashboard exercise. It required careful thought about:
- which measures were leading versus lagging
- which signals were actionable
- what dependencies existed between data sources
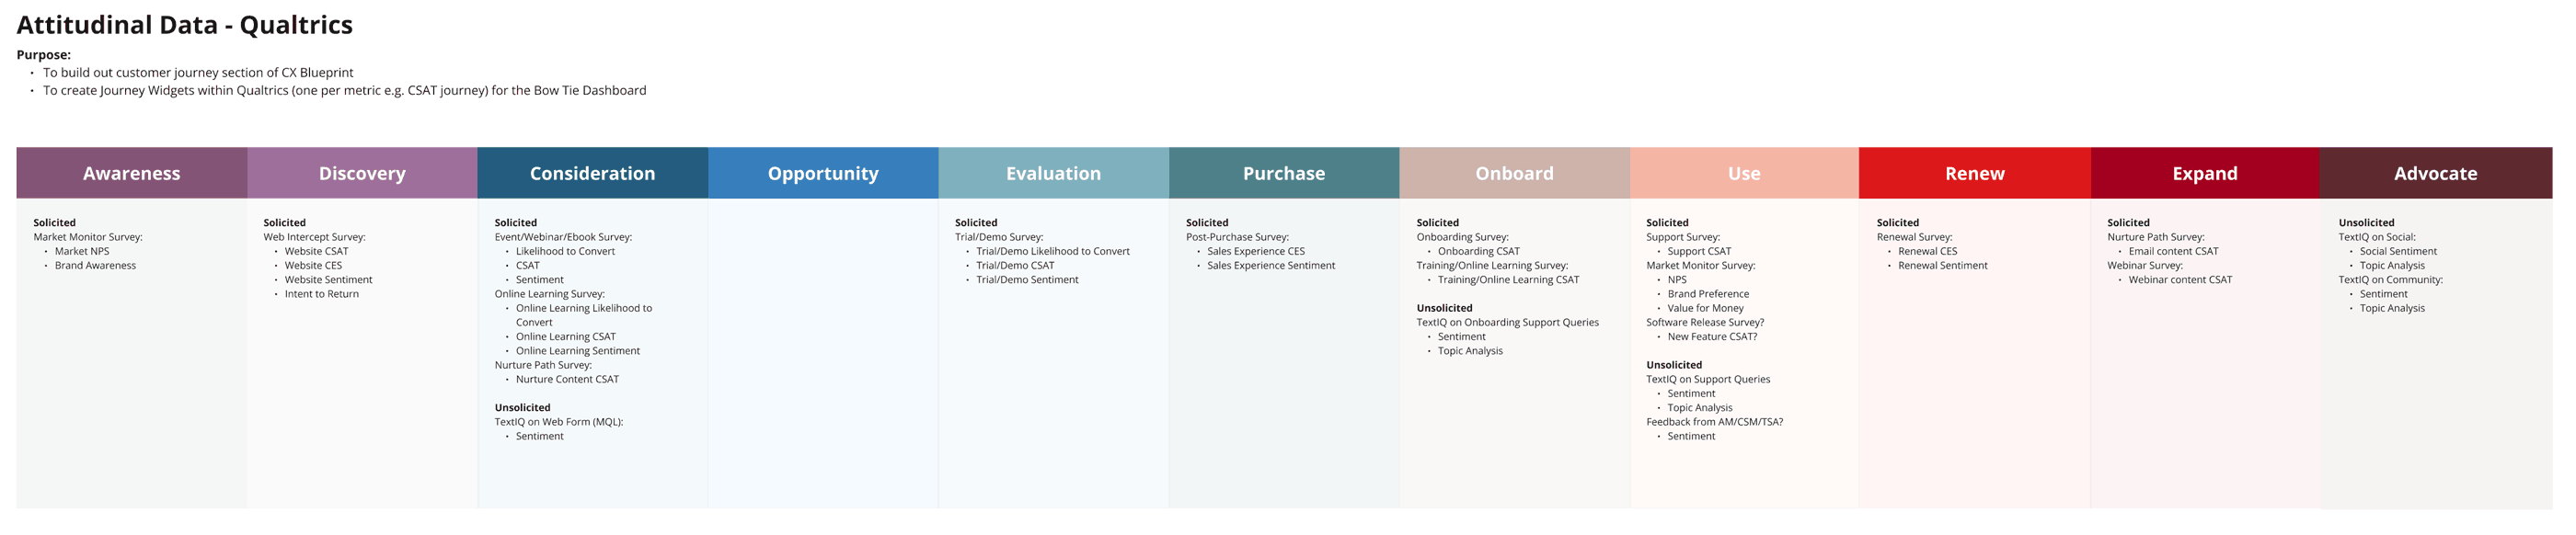
- where attitudinal data was needed alongside behavioural data
- how to avoid rewarding activity that did not actually create value
That is where the framework became more rigorous.
Making The Framework Usable
Section titled “Making The Framework Usable”A framework only matters if people can actually work with it.
That is why a key part of the programme was translating the model into something operational: a live dashboard and a clearer shared view of the journey that teams could use to track progress, identify issues earlier, and align conversations around the same source of truth.
From abstract strategy to a working dashboard
Section titled “From abstract strategy to a working dashboard”The dashboard was intended to provide:
- visibility into the North Star constellation at each key touchpoint
- a shared view of customer movement across the funnel
- leading indicators of future performance
- a more useful basis for prioritisation and course correction
This mattered because the organisation did not need another static framework document. It needed something that could help teams make better decisions while the work was still in motion.
Why this was a CX strategy project, not just an analytics one
Section titled “Why this was a CX strategy project, not just an analytics one”It would be easy to describe this as metric planning. But that would miss the more important point.
This was fundamentally a customer experience strategy project. The metrics were useful because they were tied back to the customer journey, customer value, and product reality. They were not just internal scorekeeping. They were a way of making the experience more visible to the organisation, especially at the points where early intervention could change outcomes.
Outcomes & Reflection
Section titled “Outcomes & Reflection”The most important outcome of this work was not a prettier dashboard. It was a clearer organisational model of success.
The North Star constellation helped shift the company:
- from siloed KPIs toward a more shared view of customer success
- from lagging revenue dependence toward stronger leading indicators
- from gut-feel prioritisation toward a more evidence-based strategy
- from disconnected journey stages toward a more end-to-end view of value creation
What this enabled
Section titled “What this enabled”- a more coherent customer journey model across pre- and post-purchase phases
- stronger alignment between product, marketing, sales, and customer success
- clearer identification of leading indicators across the funnel
- more useful discussion about which metrics actually mattered
- a stronger bridge between customer experience thinking and business strategy
Reflection
Section titled “Reflection”What I like about this project is that it shows UX strategy doing the kind of work that often sits outside traditional product portfolios.
This was not a screen redesign. It was a way of helping the organisation think more clearly about value: where it is created, how it moves, what signals matter, and how teams can align around something more meaningful than disconnected KPI sets.
The interesting part was not simply inventing a framework. It was using customer journey thinking to make the business more legible to itself.
That is what made the work useful.
Because once teams could see how attention, transaction, productivity, loyalty, and advocacy connected across the bow tie, they were in a much better position to make decisions that actually improved the customer experience — and not just the reporting around it.